from torch_snippets.loader import *
from sklearn.datasets import make_moons

np.random.seed(10)
x, y = make_moons(1000, noise=0.1)
df = pd.DataFrame({"x1": x[:, 0], "x2": x[:, 1], "y": y})

Chart(df).mark_circle().encode(x="x1:Q", y="x2:Q", color="y:N").interactive()Altair and Other Charts
Refer to altair-viz.github.io for more awesome charts.
torch-snippets exposes a confusion matrix function CM as an example
Method 1
n = 10
a = "qwertyuiopasdfghjklzxcvbnm"
truth = np.random.randint(4, size=1000000)
pred = np.random.randint(4, size=1000000)
show(CM(truth=truth, pred=pred, mapping={i: a for i, a in enumerate(a)}))
# mapping is optional
precision recall f1-score support
0 0.25 0.25 0.25 250150
1 0.25 0.25 0.25 250245
2 0.25 0.25 0.25 249836
3 0.25 0.25 0.25 249769
accuracy 0.25 1000000
macro avg 0.25 0.25 0.25 1000000
weighted avg 0.25 0.25 0.25 1000000
Method 2
df = pd.DataFrame(
    {
        "truth": [randint(n) for _ in range(1000)],
        "pred": [randint(n) for _ in range(1000)],
    }
)
show(CM(df, "truth", "pred", mapping={i: a for i, a in enumerate(a)}))
# mapping is optional
precision recall f1-score support
0 0.13 0.14 0.13 92
1 0.08 0.09 0.08 101
2 0.13 0.12 0.13 107
3 0.06 0.06 0.06 105
4 0.12 0.11 0.11 94
5 0.12 0.09 0.10 115
6 0.08 0.10 0.09 88
7 0.08 0.07 0.08 113
8 0.09 0.09 0.09 99
9 0.12 0.15 0.13 86
accuracy 0.10 1000
macro avg 0.10 0.10 0.10 1000
weighted avg 0.10 0.10 0.10 1000
Method 3
df = pd.DataFrame(
    {
        "truth": [choose("abcd") for _ in range(1000)],
        "pred": [choose("abcd") for _ in range(1000)],
    }
)
show(CM(df, "truth", "pred"))
# mapping is optional
precision recall f1-score support
a 0.25 0.29 0.27 229
b 0.28 0.29 0.28 256
c 0.27 0.24 0.26 267
d 0.26 0.25 0.25 248
accuracy 0.27 1000
macro avg 0.26 0.27 0.26 1000
weighted avg 0.27 0.27 0.26 1000
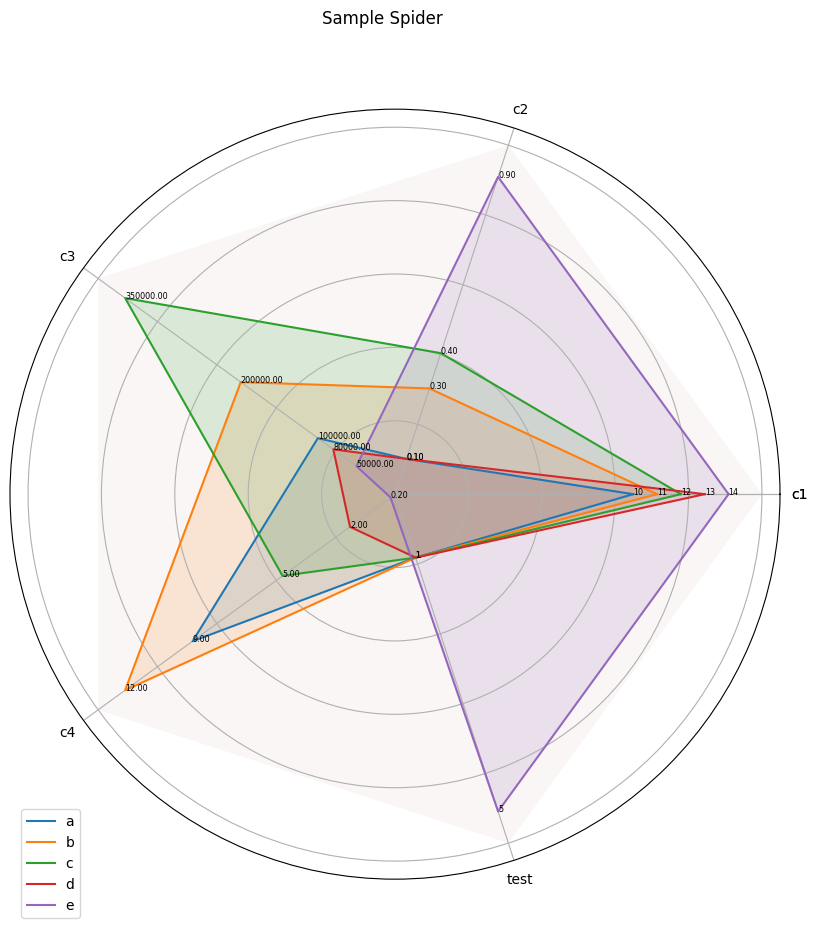
spider
 spider (df, id_column=None, title=None, max_values=None, padding=1.25,
         global_scale=False, ax=None, sz=10)
*Plot a spider chart based on the given dataframe.
Parameters: - df: pandas DataFrame The input dataframe containing the data to be plotted. - id_column: str, optional The column name to be used as the identifier for each data point. If not provided, the index of the dataframe will be used. - title: str, optional The title of the spider chart. - max_values: dict, optional A dictionary specifying the maximum values for each category. If not provided, the maximum values will be calculated based on the data. - padding: float, optional The padding factor to be applied when calculating the maximum values. Default is 1.25. - global_scale: bool or float, optional If False, each category will have its own maximum value. If True, a single maximum value will be used for all categories. If a float value is provided, it will be used as the maximum value for all categories. - ax: matplotlib Axes, optional The axes on which to plot the spider chart. If not provided, a new figure and axes will be created. - sz: float, optional The size of the figure (both width and height) in inches. Default is 10.
Returns: - None
Example usage: spider(df, id_column=‘model’, title=‘Spider Chart’, max_values={‘category1’: 10, ‘category2’: 20}, padding=1.5)*
import pandas as pd

spider(
    pd.DataFrame(
        {
            "x": [*"abcde"],
            "c1": [10, 11, 12, 13, 14],
            "c2": [0.1, 0.3, 0.4, 0.1, 0.9],
            "c3": [1e5, 2e5, 3.5e5, 8e4, 5e4],
            "c4": [9, 12, 5, 2, 0.2],
            "test": [1, 1, 1, 1, 5],
        },
        index=[*"abcde"],
    ),
    title="Sample Spider",
    padding=1.1,
)
UpSetAltair
 UpSetAltair (data=None, title='', subtitle='', sets=None, abbre=None,
              sort_by='frequency', sort_order='ascending', width=1200,
              height=700, height_ratio=0.6,
              horizontal_bar_chart_width=300, color_range=['#55A8DB',
              '#3070B5', '#30363F', '#F1AD60', '#DF6234', '#BDC6CA'],
              highlight_color='#EA4667', glyph_size=200,
              set_label_bg_size=1000, line_connection_size=2,
              horizontal_bar_size=20, vertical_bar_label_size=16,
              vertical_bar_padding=20)
*This function generates Altair-based interactive UpSet plots.
Parameters: - data (pandas.DataFrame): Tabular data containing the membership of each element (row) in exclusive intersecting sets (column). - sets (list): List of set names of interest to show in the UpSet plots. This list reflects the order of sets to be shown in the plots as well. - abbre (list): Abbreviated set names. - sort_by (str): “frequency” or “degree” - sort_order (str): “ascending” or “descending” - width (int): Vertical size of the UpSet plot. - height (int): Horizontal size of the UpSet plot. - height_ratio (float): Ratio of height between upper and under views, ranges from 0 to 1. - horizontal_bar_chart_width (int): Width of horizontal bar chart on the bottom-right. - color_range (list): Color to encode sets. - highlight_color (str): Color to encode intersecting sets upon mouse hover. - glyph_size (int): Size of UpSet glyph (⬤). - set_label_bg_size (int): Size of label background in the horizontal bar chart. - line_connection_size (int): width of lines in matrix view. - horizontal_bar_size (int): Height of bars in the horizontal bar chart. - vertical_bar_label_size (int): Font size of texts in the vertical bar chart on the top. - vertical_bar_padding (int): Gap between a pair of bars in the vertical bar charts.*
upsetaltair_top_level_configuration
 upsetaltair_top_level_configuration (base, legend_orient='top-left',
                                      legend_symbol_size=30)
*Configure the top-level settings for an UpSet plot in Altair.
Parameters: - base: The base chart to configure. - legend_orient: The orientation of the legend. Default is “top-left”. - legend_symbol_size: The size of the legend symbols. Default is 30.
Returns: - The configured chart.*
df| truth | pred | |
|---|---|---|
| 0 | c | d |
| 1 | c | c |
| 2 | d | d |
| 3 | c | a |
| 4 | d | c |
| ... | ... | ... |
| 995 | c | c |
| 996 | a | c |
| 997 | b | a |
| 998 | b | c |
| 999 | a | d |
1000 rows × 2 columns
# import numpy as np

# i = np.random.randn(300, 7) > 0.33
# df = pd.DataFrame(i.astype(int))
# df.columns = [rand() for _ in range(len(df.columns))]
# show(df)

# UpSetAltair(
#     df,
#     sets=list(df.columns),
#     abbre=list(df.columns),
#     sort_by="frequencey",
#     sort_order="ascending",
# )
df
| 4wST3l | v6Vv72 | WKSGX4 | LBlidv | g0LDKa | xpK2f5 | pW4oKO | |
|---|---|---|---|---|---|---|---|
| 0 | 0 | 1 | 0 | 1 | 0 | 0 | 1 |
| 1 | 1 | 0 | 0 | 1 | 0 | 1 | 0 |
| 2 | 1 | 0 | 1 | 0 | 0 | 1 | 0 |
| 3 | 1 | 0 | 0 | 0 | 0 | 0 | 1 |
| 4 | 0 | 0 | 1 | 0 | 1 | 0 | 1 |
| 5 | 0 | 0 | 0 | 1 | 0 | 0 | 0 |
| 6 | 1 | 0 | 0 | 1 | 1 | 0 | 1 |
| 7 | 1 | 1 | 1 | 1 | 0 | 1 | 1 |
| 8 | 1 | 0 | 0 | 1 | 0 | 1 | 1 |
| 9 | 1 | 0 | 0 | 1 | 0 | 0 | 0 |
| 10 | 1 | 0 | 0 | 0 | 0 | 0 | 1 |
| 11 | 1 | 0 | 1 | 1 | 0 | 0 | 0 |
| 12 | 0 | 1 | 0 | 1 | 0 | 0 | 1 |
| 13 | 1 | 0 | 0 | 1 | 0 | 1 | 1 |
| 14 | 1 | 1 | 0 | 1 | 0 | 0 | 0 |
| ... | ... | ... | ... | ... | ... | ... | ... |
| 285 | 1 | 0 | 0 | 0 | 0 | 0 | 0 |
| 286 | 1 | 0 | 0 | 1 | 1 | 1 | 1 |
| 287 | 0 | 0 | 1 | 1 | 0 | 1 | 0 |
| 288 | 0 | 1 | 1 | 1 | 0 | 0 | 0 |
| 289 | 0 | 1 | 1 | 1 | 0 | 0 | 0 |
| 290 | 0 | 1 | 1 | 1 | 1 | 0 | 0 |
| 291 | 0 | 0 | 1 | 0 | 1 | 0 | 0 |
| 292 | 0 | 0 | 1 | 1 | 0 | 0 | 1 |
| 293 | 1 | 0 | 0 | 0 | 0 | 1 | 0 |
| 294 | 0 | 0 | 0 | 0 | 0 | 0 | 1 |
| 295 | 0 | 1 | 1 | 1 | 0 | 0 | 0 |
| 296 | 0 | 0 | 0 | 1 | 0 | 1 | 0 |
| 297 | 1 | 0 | 1 | 0 | 0 | 0 | 1 |
| 298 | 0 | 1 | 1 | 0 | 1 | 0 | 0 |
| 299 | 0 | 0 | 1 | 0 | 0 | 0 | 0 |
/opt/miniconda3/lib/python3.12/site-packages/altair/utils/deprecation.py:65: AltairDeprecationWarning: 'selection_multi' is deprecated.  Use 'selection_point'
  warnings.warn(message, AltairDeprecationWarning, stacklevel=1)
/opt/miniconda3/lib/python3.12/site-packages/altair/utils/deprecation.py:65: AltairDeprecationWarning: 'selection_single' is deprecated.  Use 'selection_point'
  warnings.warn(message, AltairDeprecationWarning, stacklevel=1)
--------------------------------------------------------------------------- SchemaValidationError Traceback (most recent call last) Cell In[14], line 8 5 df.columns = [rand() for _ in range(len(df.columns))] 6 show(df) ----> 8 UpSetAltair( 9 df, 10 sets=list(df.columns), 11 abbre=list(df.columns), 12 sort_by="frequencey", 13 sort_order="ascending", 14 ) Cell In[10], line 239, in UpSetAltair(data, title, subtitle, sets, abbre, sort_by, sort_order, width, height, height_ratio, horizontal_bar_chart_width, color_range, highlight_color, glyph_size, set_label_bg_size, line_connection_size, horizontal_bar_size, vertical_bar_label_size, vertical_bar_padding) 177 base = ( 178 alt.Chart(data) 179 .transform_filter(legend_selection) (...) 232 ) 233 ) 234 # Now, we have data in the following format: 235 # count, set, is_intersect, degree, intersection_id, set_abbre 236 237 # Cardinality by intersecting sets (vertical bar chart) 238 vertical_bar = ( --> 239 base.mark_bar(color=main_color, size=vertical_bar_size) 240 .encode( 241 x=alt.X( 242 "intersection_id:N", 243 axis=alt.Axis(grid=False, labels=False, ticks=False, domain=True), 244 sort=x_sort, 245 title=None, 246 ), 247 y=alt.Y( 248 "max(count):Q", 249 axis=alt.Axis(grid=False, tickCount=3, orient="right"), 250 title="Intersection Size", 251 ), 252 color=brush_color, 253 tooltip=tooltip, 254 ) 255 .properties(width=matrix_width, height=vertical_bar_chart_height) 256 ) 258 vertical_bar_text = vertical_bar.mark_text( 259 color=main_color, dy=-10, size=vertical_bar_label_size 260 ).encode(text=alt.Text("count:Q", format=".0f")) 262 vertical_bar_chart = (vertical_bar + vertical_bar_text).add_selection( 263 color_selection 264 ) File /opt/miniconda3/lib/python3.12/site-packages/altair/vegalite/v5/schema/mixins.py:2786, in MarkMethodMixin.mark_bar(self, align, angle, aria, ariaRole, ariaRoleDescription, aspect, bandSize, baseline, binSpacing, blend, clip, color, continuousBandSize, cornerRadius, cornerRadiusBottomLeft, cornerRadiusBottomRight, cornerRadiusEnd, cornerRadiusTopLeft, cornerRadiusTopRight, cursor, description, dir, discreteBandSize, dx, dy, ellipsis, fill, fillOpacity, filled, font, fontSize, fontStyle, fontWeight, height, href, innerRadius, interpolate, invalid, limit, line, lineBreak, lineHeight, minBandSize, opacity, order, orient, outerRadius, padAngle, point, radius, radius2, radius2Offset, radiusOffset, shape, size, smooth, stroke, strokeCap, strokeDash, strokeDashOffset, strokeJoin, strokeMiterLimit, strokeOffset, strokeOpacity, strokeWidth, style, tension, text, theta, theta2, theta2Offset, thetaOffset, thickness, timeUnitBandPosition, timeUnitBandSize, tooltip, url, width, x, x2, x2Offset, xOffset, y, y2, y2Offset, yOffset, **kwds) 2784 copy = self.copy(deep=False) # type: ignore[attr-defined] 2785 if any(val is not Undefined for val in kwds.values()): -> 2786 copy.mark = core.MarkDef(type="bar", **kwds) 2787 else: 2788 copy.mark = "bar" File /opt/miniconda3/lib/python3.12/site-packages/altair/vegalite/v5/schema/core.py:23720, in MarkDef.__init__(self, type, align, angle, aria, ariaRole, ariaRoleDescription, aspect, bandSize, baseline, binSpacing, blend, clip, color, continuousBandSize, cornerRadius, cornerRadiusBottomLeft, cornerRadiusBottomRight, cornerRadiusEnd, cornerRadiusTopLeft, cornerRadiusTopRight, cursor, description, dir, discreteBandSize, dx, dy, ellipsis, fill, fillOpacity, filled, font, fontSize, fontStyle, fontWeight, height, href, innerRadius, interpolate, invalid, limit, line, lineBreak, lineHeight, minBandSize, opacity, order, orient, outerRadius, padAngle, point, radius, radius2, radius2Offset, radiusOffset, shape, size, smooth, stroke, strokeCap, strokeDash, strokeDashOffset, strokeJoin, strokeMiterLimit, strokeOffset, strokeOpacity, strokeWidth, style, tension, text, theta, theta2, theta2Offset, thetaOffset, thickness, timeUnitBandPosition, timeUnitBandSize, tooltip, url, width, x, x2, x2Offset, xOffset, y, y2, y2Offset, yOffset, **kwds) 22901 def __init__( 22902 self, 22903 type: Union[ (...) 23718 **kwds, 23719 ): > 23720 super(MarkDef, self).__init__( 23721 type=type, 23722 align=align, 23723 angle=angle, 23724 aria=aria, 23725 ariaRole=ariaRole, 23726 ariaRoleDescription=ariaRoleDescription, 23727 aspect=aspect, 23728 bandSize=bandSize, 23729 baseline=baseline, 23730 binSpacing=binSpacing, 23731 blend=blend, 23732 clip=clip, 23733 color=color, 23734 continuousBandSize=continuousBandSize, 23735 cornerRadius=cornerRadius, 23736 cornerRadiusBottomLeft=cornerRadiusBottomLeft, 23737 cornerRadiusBottomRight=cornerRadiusBottomRight, 23738 cornerRadiusEnd=cornerRadiusEnd, 23739 cornerRadiusTopLeft=cornerRadiusTopLeft, 23740 cornerRadiusTopRight=cornerRadiusTopRight, 23741 cursor=cursor, 23742 description=description, 23743 dir=dir, 23744 discreteBandSize=discreteBandSize, 23745 dx=dx, 23746 dy=dy, 23747 ellipsis=ellipsis, 23748 fill=fill, 23749 fillOpacity=fillOpacity, 23750 filled=filled, 23751 font=font, 23752 fontSize=fontSize, 23753 fontStyle=fontStyle, 23754 fontWeight=fontWeight, 23755 height=height, 23756 href=href, 23757 innerRadius=innerRadius, 23758 interpolate=interpolate, 23759 invalid=invalid, 23760 limit=limit, 23761 line=line, 23762 lineBreak=lineBreak, 23763 lineHeight=lineHeight, 23764 minBandSize=minBandSize, 23765 opacity=opacity, 23766 order=order, 23767 orient=orient, 23768 outerRadius=outerRadius, 23769 padAngle=padAngle, 23770 point=point, 23771 radius=radius, 23772 radius2=radius2, 23773 radius2Offset=radius2Offset, 23774 radiusOffset=radiusOffset, 23775 shape=shape, 23776 size=size, 23777 smooth=smooth, 23778 stroke=stroke, 23779 strokeCap=strokeCap, 23780 strokeDash=strokeDash, 23781 strokeDashOffset=strokeDashOffset, 23782 strokeJoin=strokeJoin, 23783 strokeMiterLimit=strokeMiterLimit, 23784 strokeOffset=strokeOffset, 23785 strokeOpacity=strokeOpacity, 23786 strokeWidth=strokeWidth, 23787 style=style, 23788 tension=tension, 23789 text=text, 23790 theta=theta, 23791 theta2=theta2, 23792 theta2Offset=theta2Offset, 23793 thetaOffset=thetaOffset, 23794 thickness=thickness, 23795 timeUnitBandPosition=timeUnitBandPosition, 23796 timeUnitBandSize=timeUnitBandSize, 23797 tooltip=tooltip, 23798 url=url, 23799 width=width, 23800 x=x, 23801 x2=x2, 23802 x2Offset=x2Offset, 23803 xOffset=xOffset, 23804 y=y, 23805 y2=y2, 23806 y2Offset=y2Offset, 23807 yOffset=yOffset, 23808 **kwds, 23809 ) File /opt/miniconda3/lib/python3.12/site-packages/altair/vegalite/v5/schema/core.py:149, in AnyMark.__init__(self, *args, **kwds) 148 def __init__(self, *args, **kwds): --> 149 super(AnyMark, self).__init__(*args, **kwds) File /opt/miniconda3/lib/python3.12/site-packages/altair/utils/schemapi.py:771, in SchemaBase.__init__(self, *args, **kwds) 768 object.__setattr__(self, "_kwds", kwds) 770 if DEBUG_MODE and self._class_is_valid_at_instantiation: --> 771 self.to_dict(validate=True) File /opt/miniconda3/lib/python3.12/site-packages/altair/utils/schemapi.py:978, in SchemaBase.to_dict(self, validate, ignore, context) 971 self.validate(result) 972 except jsonschema.ValidationError as err: 973 # We do not raise `from err` as else the resulting 974 # traceback is very long as it contains part 975 # of the Vega-Lite schema. It would also first 976 # show the less helpful ValidationError instead of 977 # the more user friendly SchemaValidationError --> 978 raise SchemaValidationError(self, err) from None 979 return result SchemaValidationError: '-7.628865979381443' is an invalid value for `size`. -7.628865979381443 is less than the minimum of 0
ERROR:root:No traceback has been produced, nothing to debug.